Mexico City Crime
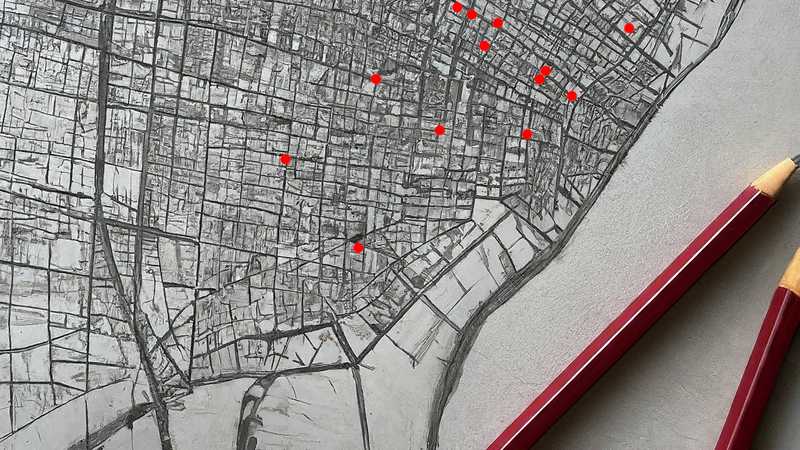
Map of homicide rates by neighborhood
⠀⠀⠀⠀⠀⠀⠀⠀ ⠀⠀⠀ ⠀ ⠀⠀⠀⠀⠀⠀⠀⠀ ⠀⠀⠀⠀
less homicides
more homicides
What is a smoothed rate?
If we simply graph the homicide rate, we can see many ups and downs, with peaks in certain neighborhoods and valleys in others. These fluctuations can be attributed to random events or normal variations due to the small population of the average neighborhoods. To obtain a clearer view of the overall trend, a statistical method called 'smoothing' is used, which considers the number of homicides in nearby neighborhoods and their population.
Official Crime Data
The Mexico City Police Department divided the city into 847 quadrants. Thanks to the open data initiative by the Mexico City government, there is geolocated data available for all crimes committed in Mexico City.
Armed with this detailed information, citizens can make informed decisions about their safety, businesses can assess risk factors for their operations, and authorities can strategically allocate resources to combat crime effectively. By pinpointing areas with higher crime rates, residents can take precautions and businesses can implement security measures. Moreover, this data empowers citizens to hold the government accountable by revealing crime hotspots and identifying potential areas of neglect
Interactive maps generated from this data can serve as powerful tools for community engagement, fostering transparency and trust between citizens and authorities.

Annualized Homicide Rate in Mexico City
The annualized homicide rate is a way of estimating how many homicides would occur in a year if the current rate of homicides continued for the entire year. It is calculated by taking the number of homicides that occurred in a given month and multiplying it by 12.
This is a useful statistic for tracking trends in homicide rates over time. For example, if the annualized homicide rate in a city is 20, this means that 20 homicides would occur in the city for every 100,000 people if the current rate continued for the entire year. If the annualized homicide rate then decreases to 10, this means that the city is making progress in reducing its homicide rate.

Number of crimes in each of the police blocks that make up Mexico City. Will you lose your iPhone or your life...


